Television has been with us for many decades now since its beginning he quickly became part of our lives.
We all enjoy watching TV now and then and we will keep watching television and enjoying our best and favourite shows. However, in the future, the way we consume television will be much different to how we did the before.
Top Television Statistics
- According to a 2015 report on average daily TV viewing in countries around the world, users in the United States lead the world in daily TV watching time, with some 274 minutes.
- As of 2015, an estimated 1.57 billion households around the world owned at least one TV set.
- Total consumption including public places or offices as such places will make up to 3 hours, 12 minutes per day.
- In May 2020, Britons watched an average of 127 minutes of linear TV a day at home.
- An average child sees 30,000 TV commercials in a year.
- By the time we reach the age of 65, we will have been exposed to over 2 million TV commercials.
- According to Nielsen Co., the average American views 3 hours and 46 minutes of TV each day (that’s more than 52 days of nonstop TV-watching per year).
- In total, in the UK, 13 million homes have at least one streaming subscription in Q1 2019.
- From Q4 2018, streaming subscription services increased by 8.4%, representing a total of over 1 million new users in just three months.
- The latest study we found shows that adults aged 16 spend 3.73 hours a day, representing a small decrease of 34 minutes as opposed to 2017.
- The number of Netflix users (the most popular streaming services in the UK) is 11.47 as of Q1 2019.
Television and tv consumption has become such an important part of our entertainment and many of us spend countless hours a year watching shows, sport and series. As of 2015, an estimated 1.57 billion homes around the world had at least one television set.
On this article, we going to show you TV consumption statistics and how we actually consume television today as long as what the future of television will be like.
Content Summary
- Top Television Statistics
- Television viewing statistics by country
- What age groups of the population spend more time watching television?
- How much television do we consume by country?
- TV Consumption Over Time Statistics
- What percentage of homes has a TV set in the United Kingdom?
- How many commercials do we watch?
- The most-watched in May 2020 in the United Kingdom?
- Some shocking statistics on television
- Most watched shows in 2018
- Connected Television Statistics
- Favourite tv connected network
- Sources
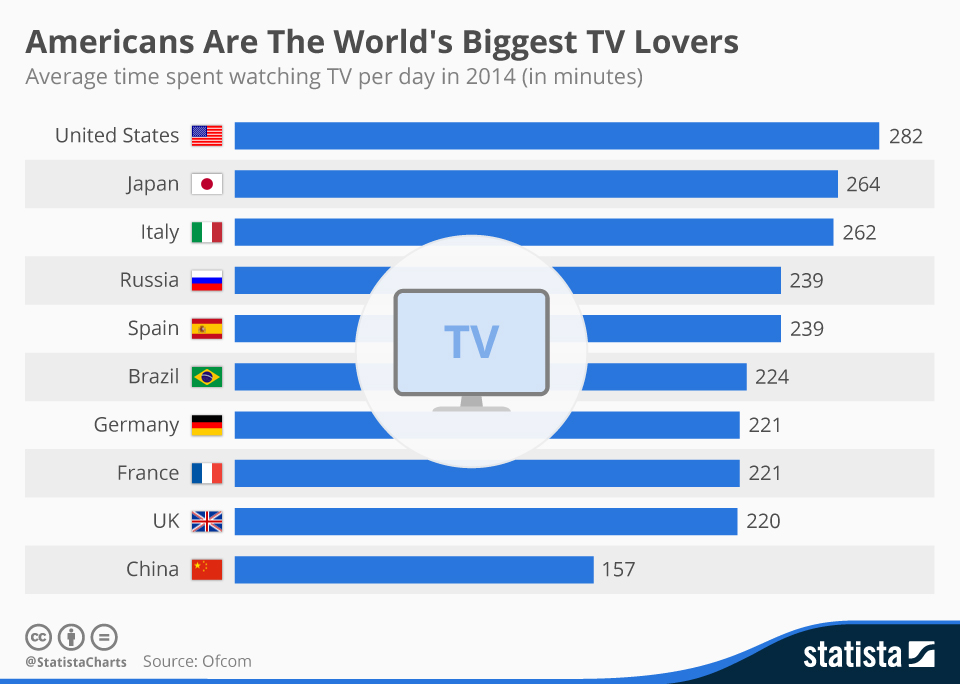
You may wonder how much television we consume around the world and how many hours we actually spent watching TV on a daily basis. You’ve got the answer here.
According to a report from 2015 to average daily time viewing is 274 minutes a day which is the same and understanding of all the three hours of Television consumption that.
Americans leave this chart followed by Western Europeans Western and Latin America. At the bottom of the list we find the people living in the Asia Pacific region.
According to a 2015 report on average daily TV viewing in countries around the world, users in the United States lead the world in daily TV watching time, with some 274 minutes
Statistic – Fact
This might seem a bit shocking as you might spend half of that time watching television per day. However many other people that actually spend over time but this figure of the average is estimated by dividing how many hours of television we consume a day by the total viewers.
As of 2015, an estimated 1.57 billion households around the world owned at least one TV set.
Statistic – Fact
According to a 2015 report on average daily TV viewing in countries around the world, users in the United States lead the world in daily TV watching time, with some 274 minutes, the equivalent of more than four and a half hours.
Statistic – Fact
Television viewing statistics by country
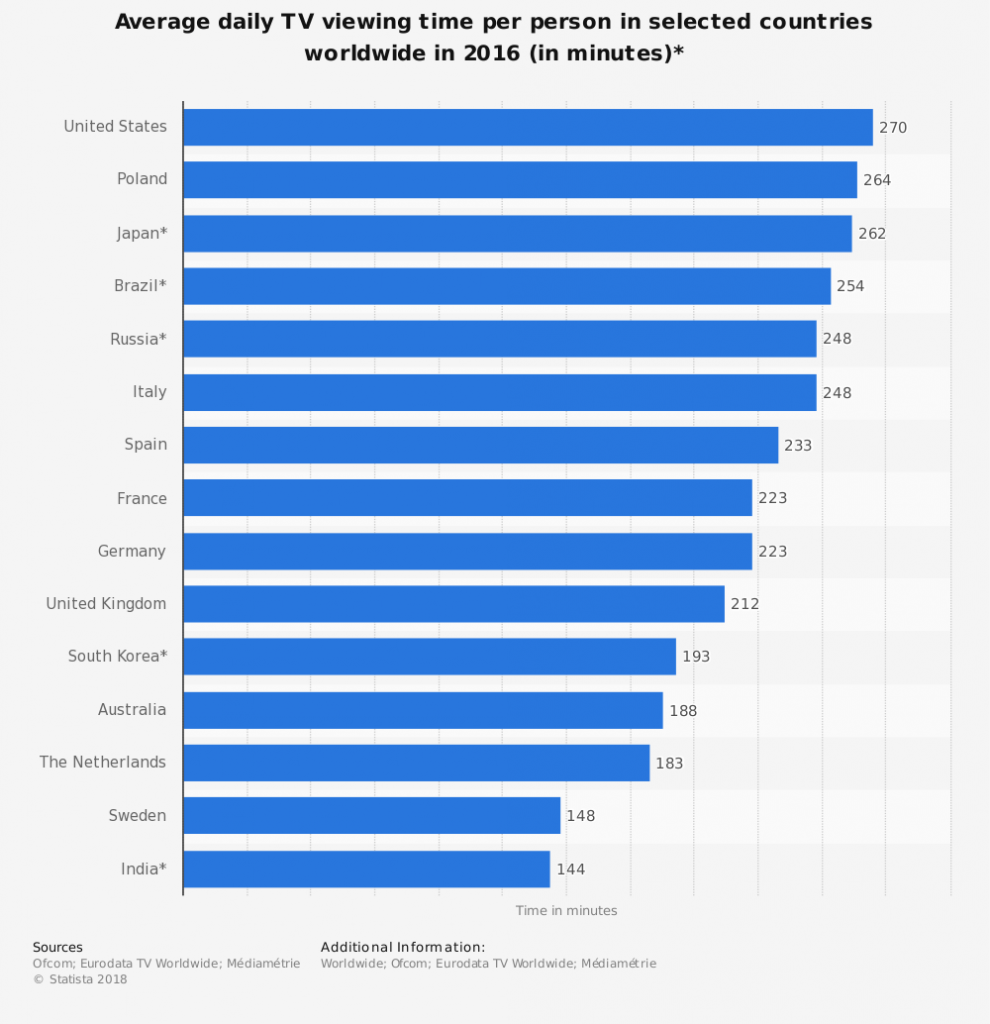
USA, Poland, Japan, Brazil and Russia are the top five countries when it comes to the amount of time spent in front of the TV.
However, as an increasing number of people turn to the internet and streaming services for their television fix, the number of U.S. households without television is on the rise
What age groups of the population spend more time watching television?
It is not surprising the fact that teenagers consume more television than any other group age, they have lots of free time and let’s be honest, they do enjoy television – at least I did when I was in my teens.
Adults aged 16 spend 3.73 hours a day, representing a small decrease of 34 minutes as opposed to 2017.
Statistic – Fact
How much television do we consume by country?
Below is a chart containing the average daily consumption of on-demand media worldwide by age group as you. As you can see the United Kingdom and United States lead when it comes to TV consumption.
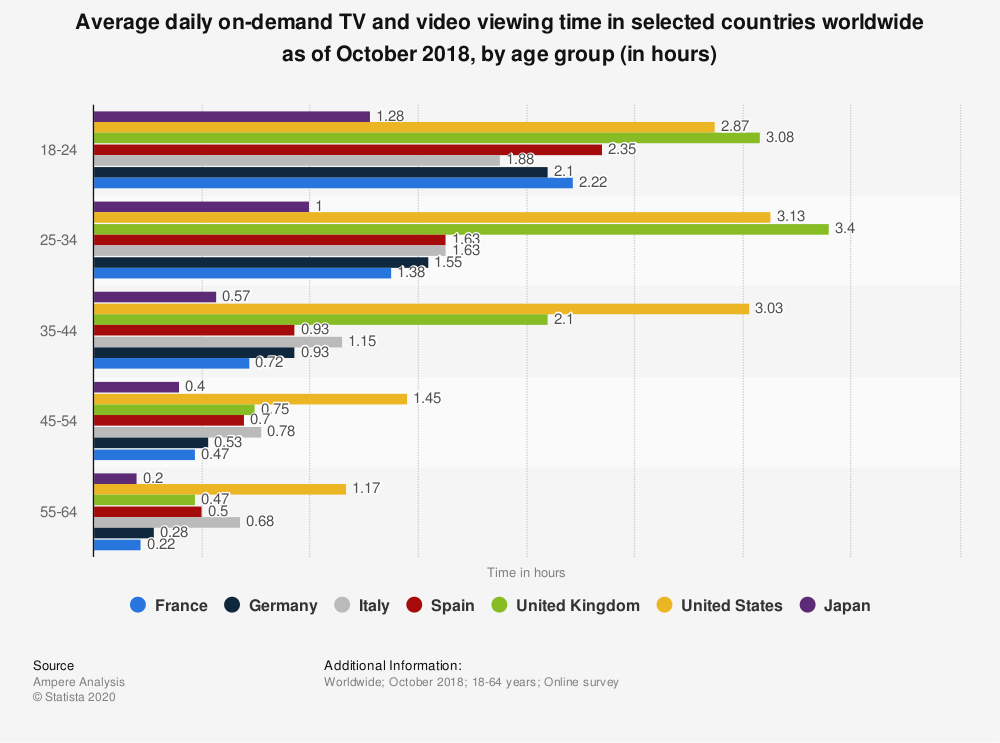
It is surprising then or just laid there actually joy by far big difference compared to the countries behind. Countries like Germany France Italy and Spain Show show a similar average viewing time.
TV Consumption Over Time Statistics
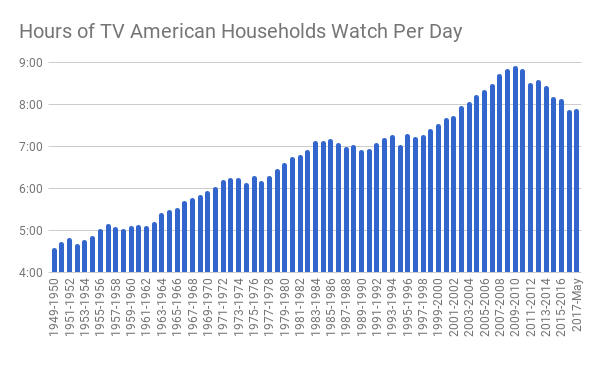
What percentage of homes has a TV set in the United Kingdom?
According to the House of Commons, as of Q1 2019, there were in the UK around 27.2 million homes which possessed a television set, totalling 95% of all households.
The number of households owning a TV increased by 4.8 times over the last 60 years, compared to 1956 when only 5.7 million or 36% of all households had a TV.
In May 2020, Britons watched an average of 127 minutes of linear TV a day at home.
Statistic – Fact
In May in the United Kingdom, linear television watching time increased slightly, considering we were in lockdown during the coronavirus crisis situation is not surprising.
Total TV consumption including public places or offices as such places will make up to 3 hours, 12 minutes per day.
Statistic – Fact
Either way, this figure is relatively understanding as many people are locked in their home without any work to do.
How many commercials do we watch?
You’re my wonder how many commercials they will watch a day. As you can see below children are exposed to about 30,000 TV commercials in just a single year. Consider also how many adsSuch as banners letters we consume in a culture and the starting number will be shocking.
An average child sees 30,000 TV commercials in a year.
Statistic – Fact
By the time we reach the age of 65, we will have been exposedto over 2 million TV commercials
Statistic – Fact
The most-watched in May 2020 in the United Kingdom?
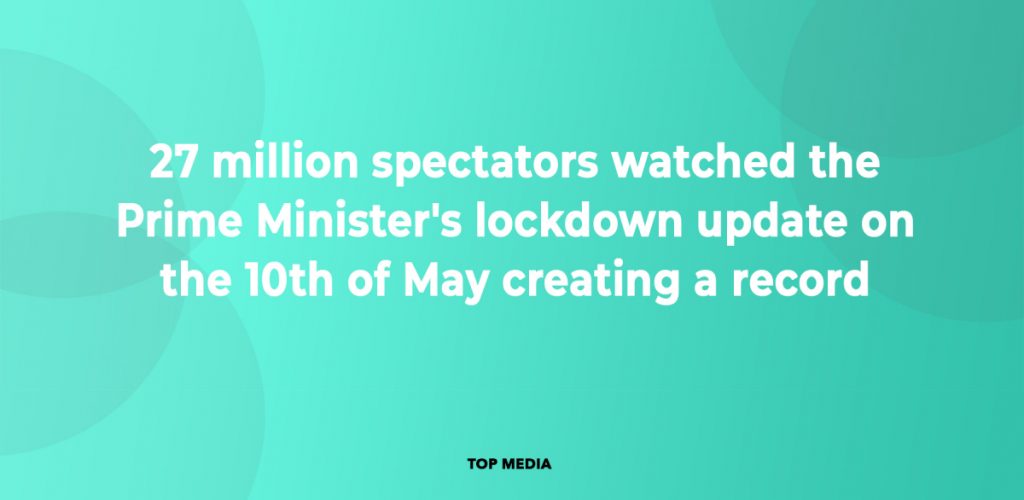
You might be wondering what were the topmost views on television. At the very top, we find Boris Johnson’s message to the Nation delivering the update on the coronavirus crisis. The total weekly reach of linear TV for individuals remains high at 88.2 %.
When it comes to shows and films, the most-watched show on linear television was Gangs of London on Sky Atlantic which with a whopping 83.6% of its audience watching on a device.
Some shocking statistics on television
Needless to say that television consumption might be among the top entertainment activities. How many hours shall one dedicate for an amusing activity climb right to the top?
It seems like spending around full 52 days a year is a solid reason to label something as probably the top entertainment activity.
It might be a holiday if you are lucky enough competing closely with television when we talk about entertainment and amusement.
According to Nielsen Co., the average American viewes 3 hours and 46 minutes of TV each day.
Statistic – Fact
Most watched shows in 2018
So what are the shows that capture the most attention from the US? In 2018 the World Cup accrued more views than almost any other show managing to put up seven games on the top 10 most Bud so what are the shows that capture most attention from viewers?
In 2018 the World Cup accrued more views than almost any other show managing to put up seven games on the top 10 most viewed in the year.
The list is completed by “Bodyguard”, “I’m a Celebrity Get me Out of Here” and “Strictly Come Dancing: the final”.

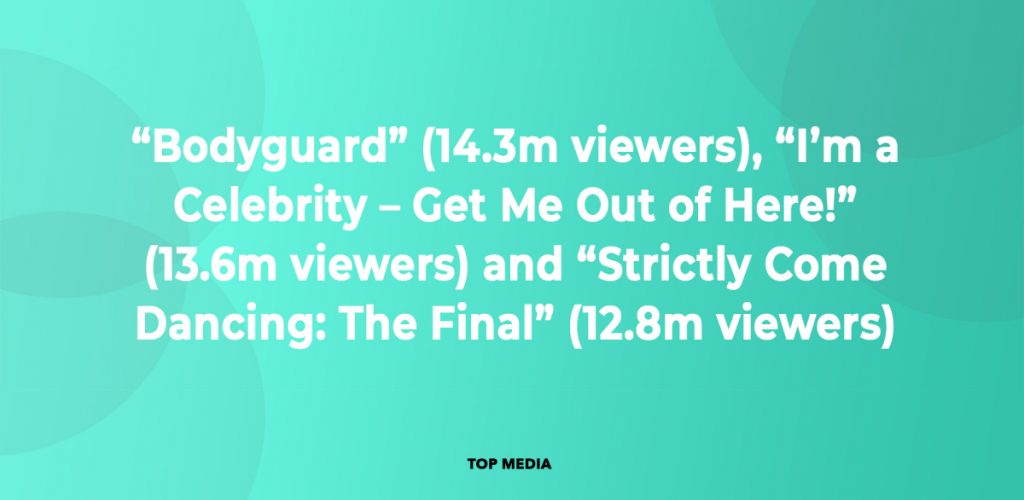
- “Bodyguard” (14.3m viewers), “I’m a Celebrity – Get Me Out of Here!” (13.6m viewers) and “Strictly Come Dancing: The Final” (12.8m viewers) made up the other top 10 shows of the year.
Connected Television Statistics
Streaming services have become very popular over the last few years. Services such as Netflix, Amazon Video or Now Tv are disrupting the way we are consuming shows and television creating a lasting impact on linear television in general.
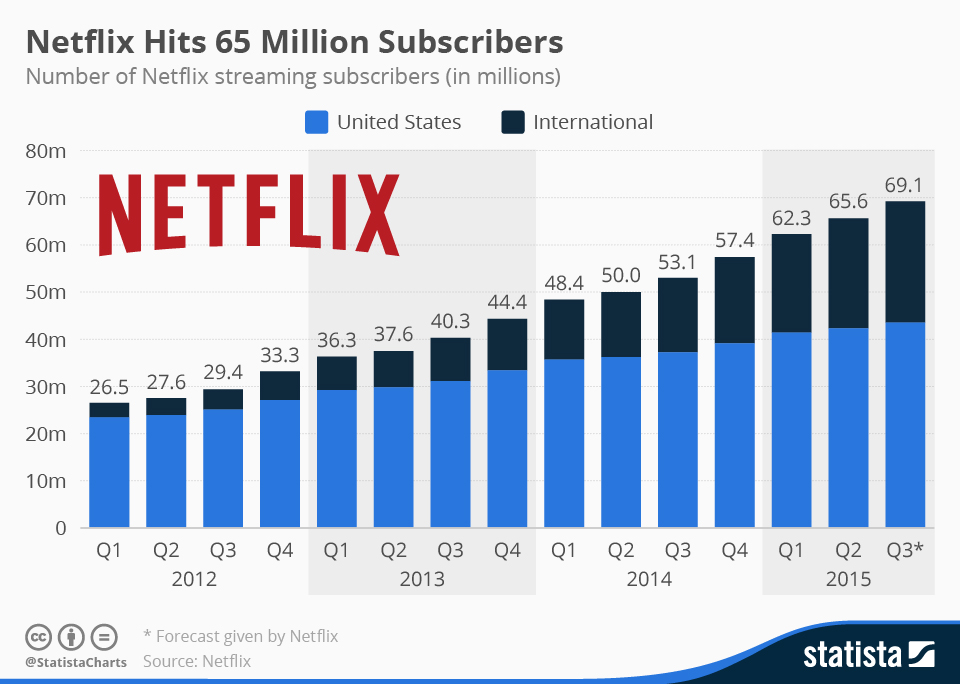
In the United Kingdom, streaming services penetration rate is over 46% which means almost half of the homes have access to at least one of the following streaming services: Amazon, Netflix or Now TV.
In total, in the UK, 13 million homes have at least one streaming subscription in Q1 2019.
Statistic – Fact
From Q4 2018, streaming subscription services increased by 8.4%, representing a total of over 1 million new users in just three months.
Statistic – Fact
Streaming services keep growing each year and experts predict that ultimately most television services will be one of the two: streaming or on-demand.
The rise of Netflix brought many other competitors and services like Amazon Video or even Disney Plus now which just recently started their own subscription services.
The number of Netflix users (the most popular streaming services in the UK) is 11.47 as of Q1 2019
Statistic – Fact
The fact that it’s streaming services increasing it’s quite obvious that. But what kind of impact is this having on how we consume television?
As a result, the number of pay-TV subscribers has not to be decreased from 2000 2010 to 2016. It is wise to assume that as viewers are switching from more traditional pay cable and linear TV to on-demand subscribing services.
And it is expected to keep dropping, by 2022 equal to 90,7 million ss opposed to 100 million users in 2010.
Favourite tv connected network
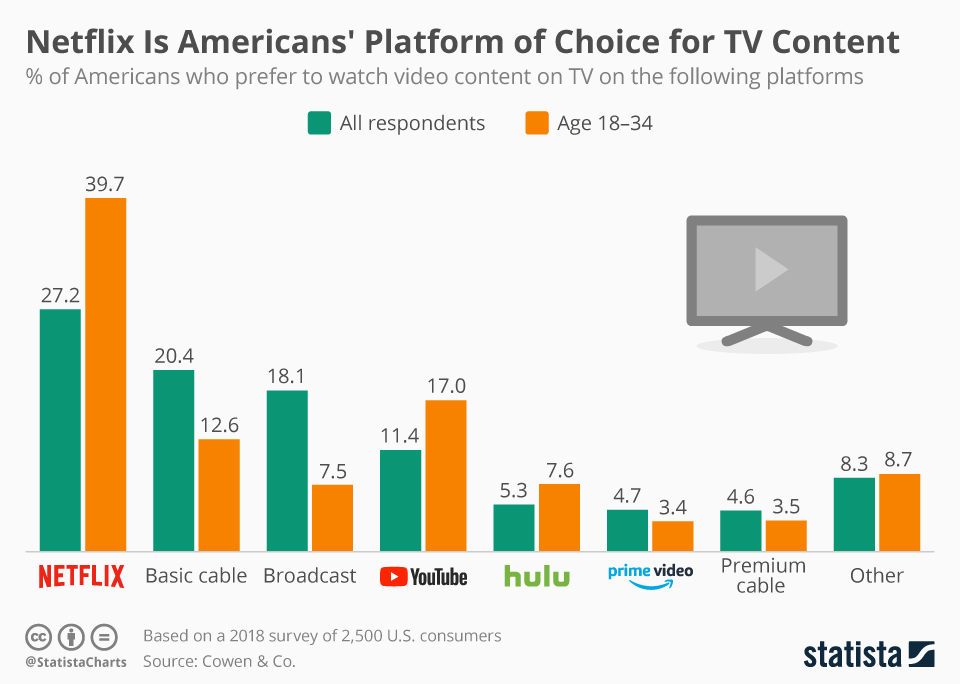
Americans favourite streaming platform is Netflix followed by basic and cable networks. YouTube seems to enjoy a very good position in the competition and Prime Video looks like losing the war for now.
