All the advertising statistics you need to know before you start any campaign. This article is a collection of the most relevant advertising statistics that you will give a deep understanding of how different advertising channel such as television, radio and PPC work so you can make the best choice for your campaign.
Different channel works for different audiences and some might not be adequate for your product.
Top Advertising Statistics
- U.S. TV ad spending was up by 3.1% in 2018, finishing the year at $72.4 billion
- 59% of marketers said that they will be increasing their budgets for advanced TV, including data-driven linear TV and addressable TV
- In the long-term (3 years after the campaign was over), 86% of the campaigns resulted in a profitable return
- In Finland, television reaches 97% of the population monthly
- In Brazil, an average 400 GRP TV campaign generate almost 800 millions views
- On average, based on the available data, TV accounts for 90% of the average viewer’s video time
- In Spain, the average time spent watching TV has increased from 3h39 a day in 2006 to 3h51 in 2016
- Newspapers and magazines have 63% of popularity among consumers while the Internet has just 25%
- 61% of readers trust newspapers ads as opposed to 42% who give credibility to online ones
- In general, 80% of traditional mail is opened while 80% of emails is disregarded (just 20% is read)
- The average response rate for printed mail is 4.4% as opposed to 0.12% for emails
- 95 per cent of people under 25 read magazines
- Consumers who receive print mail promoting online sites spend 13% more than those who just receive digital info
- 46% per cent of readers uses print and digital formats
- 70% of American prefer to read printed mail
- People are 70% more likely to remember businesses seen in print compared to online
- Google and Facebook possess the largest market share of digital ad spend with 38.6% and 19.9%, respectively.
- On Google Ads, companies make an average of $2 in revenue for every $1 they spend
- The average click-through rate (CTR) in Google Ads across all industries is 3.17% for the search network.
- And the average cost per click (CPC) is $2.69 on the search network and $0.63 on the display network.
- Omnichannel advertising is one of the most effective strategies as it generates 80% higher rate of incremental store visits for local businesses
- Social media platforms account for 33% of the time spent online.
- 25% of users admit to following their favourite brands on social media.
- 37% of digital consumers use social media to purchase inspiration.
- 96% of B2C marketers believe that social media is one of the most relevant marketing platforms.
- 69% of digital media time is spent on mobile devices.
- 82% of smartphone users consult their phones while in a store.
- Email marketing campaigns have an average conversion rate of 4.29%.
- Gmail ads open rate is around 2% and its cost-per-click is of roughly $1. That drops to less than 20 cents for ads with an open rate above 25%.
- Revenue from email campaigns made up an average of 21% of companies’ overall revenue, up from 17% in 2016
- Google accounts for 94% of all organic traffic
- The average Google first page result contains 1,890 words. (Backlinko, 2016)
- 50% of search queries on Google contain at 4. (IMPACT, 2019)
- 61% of executives admit that improving their organic traffic is their top priority. (HubSpot, 2018)
- 70-80% of users disregard paid search results on Google. (MarTech, 2018) (Source: https://www.hubspot.com/marketing-statistics)
- Billboard advertising costs 80% less than television
- With an average CPM of $5.22, billboards are, in may cases, less cost-prohibitive than online ads whose prices continue to grow
- 71% of Consumers Often Look at the Messages on Roadside Billboards
- Nearly 26% of consumers visited a store as a result of seeing an OOH ad
- Billboards make up 66% of the OOH advertising market
- Over 7,800 digital billboards are currently active in the US
- In the US, there are around 370k active billboards and about 15k new ones added each year
- The average cost per billboard in the UK is £200-500 for two week
- Billboard advertising only makes up about 7% of the total ad budget
- Clear Channel UK, the second-largest providers of OOH advertising has around 4000 billboards across the US
- By 2021, billboards are expected to grow to a $33B industry
- 98% of people see an OOH ad each week
- Over 92 % of Americans over 12 years old listen to the radio weekly
- Radio audience comes up to over 235 million listeners
- Online radio consumption has increased over the last years and nowadays it accounts for 20% of the total
- There are more country music stations in America than any other type with over 2,000. News/talk follows with 1,375 stations
- Major brands such as Verizon, Home Depot, Walt Disney and Burger King are among the top 20 largest radio advertisers
- Retail, automotive, insurance, restaurants and financial institutions are the largest advertising industries for radio
- Radio advertising revenue surpassed $20 billion in 2017, and over $15 billion is from local businesses
- All type of radio formats reach 90% of the population in the UK every week (Rajar)
- 89.7% of the UK’s (54.4m adults over the age of 15) listen to the radio each week
- Average of 21.3 hours a week
- This year its reach is up to 9.8m each week in the UK (The Drum)
- Digital radio consumption grows every year, from 45.2% at the end of 2016 to 49.9% a year later
- Out-of-home advertising revenue in the UK is 1.6bn
- People spend 70% of their time outdoors
- Nearly 26% of people visited a store as a result of seeing an OOH ad
- 98% of consumers are exposed to some format of OOH advertising each week
- 83% of people admit remembering OOH ads they saw within the last 30 min of going shopping (Outsmart, Window of Influence, 2011)
- In the US, there are around 370k active billboards and about 15k new ones added each year
- The number of billboards is growing in the US, especially, digital billboards.
- 3.79 ROI for retailers per every $1 spent on Out-Of-Home advertising
Television advertising statistics
U.S. TV ad spending was up by 3.1% in 2018, finishing the year at $72.4 billion
Statistic – Fact
Tv ad spend has gone up and while most marketers are increasing their budget for their online campaigns, TV ads are increasing because they are very effective.
59% of marketers said that they will be increasing their budgets for advanced TV, including data-driven linear TV and addressable TV
Statistic – Fact
Long and short term effectiveness are very important when choosing what kind of campaign to run. For short promotions or campaigns, it is crucial to define what kind of campaign is more convenient for a product, time of year and decide whether it is optimal for the campaign’s goals.
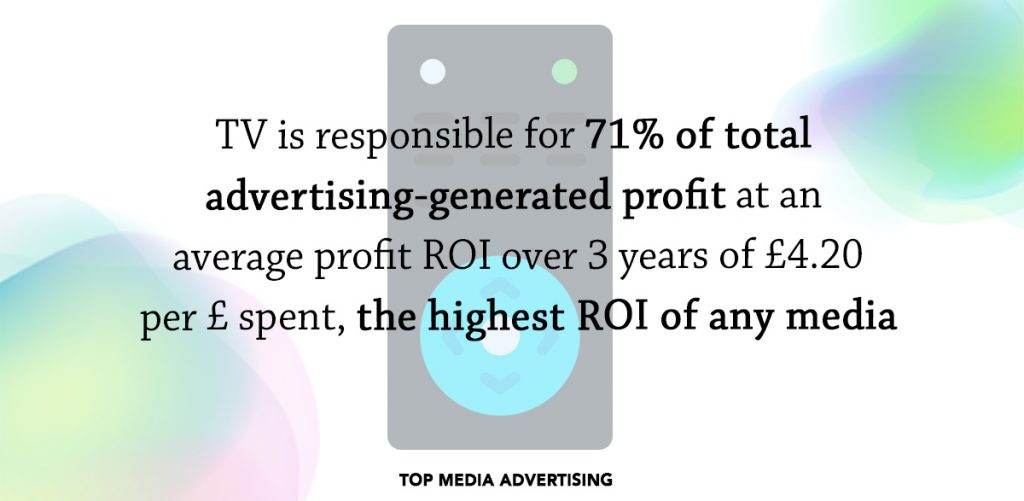
In the long-term (3 years after the campaign was over), 86% of the campaigns resulted in a profitable return
Statistic – Fact
And in the long-term, in the three years after ad campaigns had finished, 86% of TV advertising campaigns delivered a profitable return.
If you are thinking about starting an advertising campaign, the following data would be very helpful towards indicating which marketing channel should you choose to make the most of your budget.
In Finland, television reaches 97% of the population monthly
Statistic – Fact
In Brazil, an average 400 GRP TV campaign generate almost 800 millions views
Statistic – Fact
Television advertising is considered as very expensive and to be honest, it is not the cheapest way to promote a product however it can be really effective and create brand awareness very fast.
On average, based on the available data, TV accounts for 90% of the average viewer’s video time
Statistic – Fact

In Spain, the average time spent watching TV has increased from 3h39 a day in 2006 to 3h51 in 2016
Statistic – Fact
If this seems to you as a very high figure, you will need to reconsider as Americans TV time spent is much higher. Adults in the U.S. are watching nearly 5 hours of television per day on average, which is equal to more than 77 days per year.
Newspapers and Print advertising statistics
Newspapers and magazines have 63% of popularity among consumers while the Internet has just 25%
Statistic – Fact
Newspaper and magazines are perceived as more reliable than the internet. When it comes to advertising, your brand would benefit more by advertising on a trustworthy media.
61% of readers trust newspapers ads as opposed to 42% who give credibility to online ones
Statistic – Fact
By combining print and digital ads, it will make online campaigns 400 % more effective Traditional and digital campaigns are more effective when used together. By using an omnichannel approach, companies will always achieve better results at driving sales.
In general, 80% of traditional mail is opened while 80% of emails is disregarded (just 20% is read)
Statistic – Fact
Traditional mail is more impactful than emails. While emails are widely disregarded, traditional mail opening rate is as high as 80%.
The average response rate for printed mail is 4.4% as opposed to 0.12% for emails
Statistic – Fact
95 per cent of people under 25 read magazines
Statistic – Fact
Although we spend over 6 over a day on screen, people are still using magazine even younger ones. Magazines – either printed or digital – reach 95% of people under 25.
Consumers who receive print mail promoting online sites spend 13% more than those who just receive digital info
Statistic – Fact
46% per cent of readers uses print and digital formats
Statistic – Fact
Consumers habits on newspapers and magazines have changed a lot since the rise of the digital technologies, printed media consumerism have dropped notably and many have turned into digital versions and social media to find out about current affairs and trends.
70% of American prefer to read printed mail
Statistic – Fact
People are 70% more likely to remember businesses seen in print compared to online
Statistic – Fact
When it comes to creating a memorable impression on the consumer, print is definitely more effective than digital formats. It is probably the fact online users get inundated with banners, popup window, sign-ups and emails that make it much harder to create an impact on them.
Digital advertising statistics
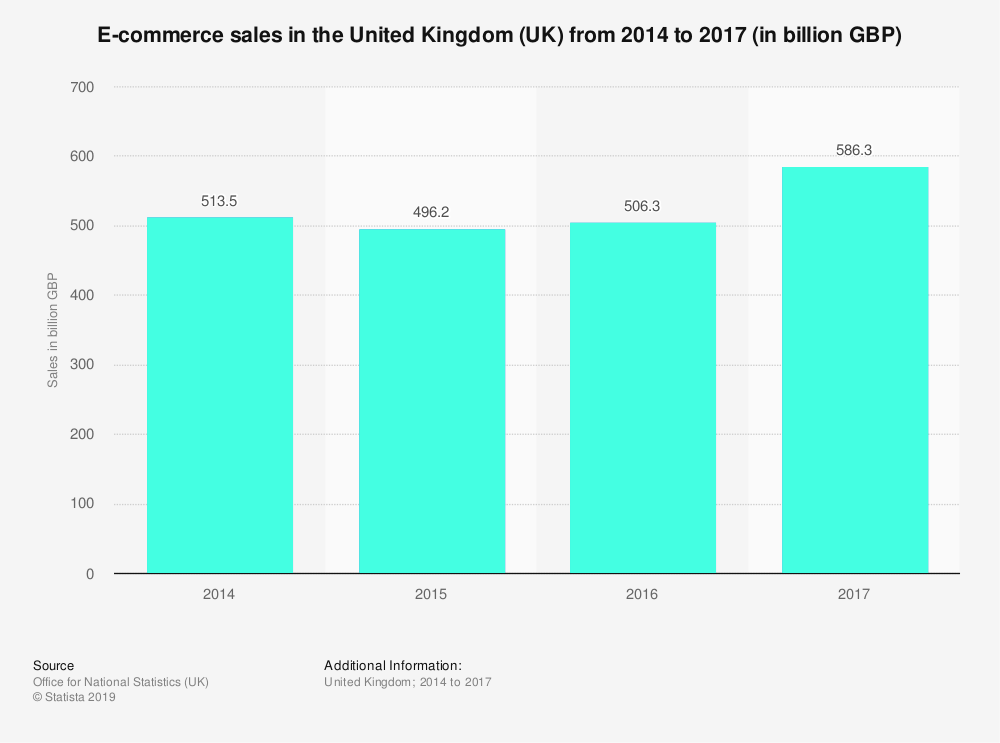
Google and Facebook possess the largest market share of digital ad spend with 38.6% and 19.9%, respectively.
Statistic – Fact
Digital advertising has grown enormously over the past two decades, and nowadays it owns the largest share in the ad market.
Will Facebook and Google advertising continue growing? Digital advertising will keep growing certainly as some other media like newspapers and billboards are becoming more digital.
On Google Ads, companies make an average of $2 in revenue for every $1 they spend
Statistic – Fact
The average click-through rate (CTR) in Google Ads across all industries is 3.17% for the search network.
Statistic – Fact
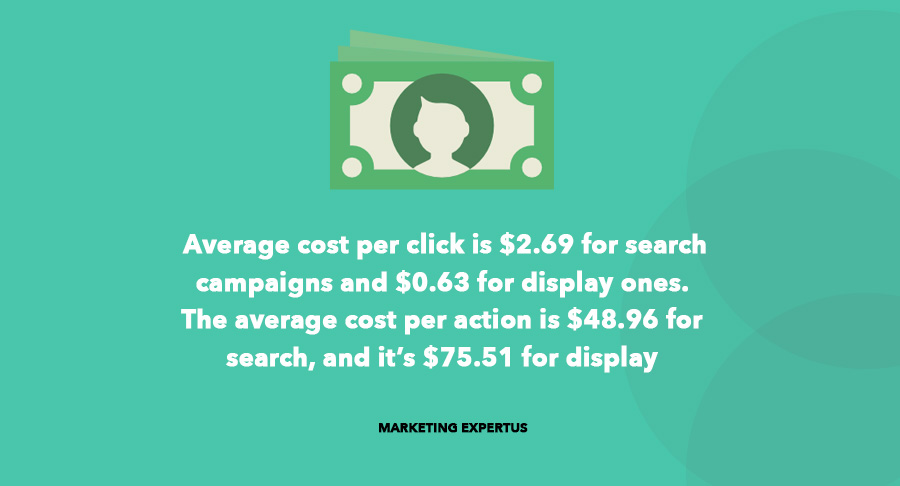
And the average cost per click (CPC) is $2.69 on the search network and $0.63 on the display network.
Statistic – Fact
The average cost-per-click on Google search network is 2.69 dollars however for some industries and location this could be much higher. And some click could cost as much as 50 dollars.
5. Omnichannel advertising is one of the most effective strategies as it generates 80% higher rate of incremental store visits for local businesses
Statistic – Fact
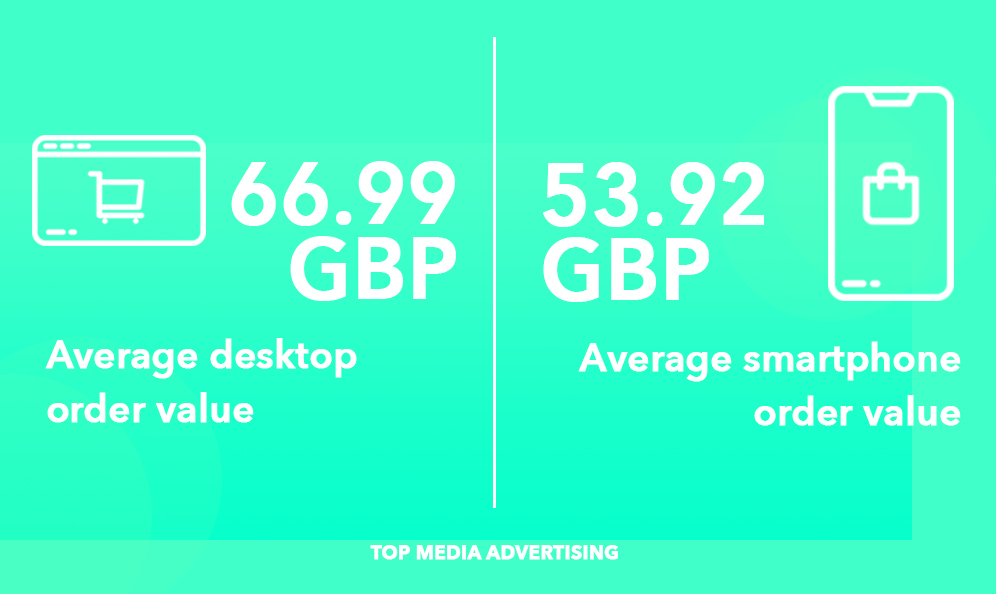
Digital advertising or traditional media, which one is better? There is no such thing as what channel is better, it ultimately depends on your needs and your market. But what is actually a fact is that by using an omnichannel approach, companies are achieving far better results.
6. Social media platforms account for 33% of the time spent online.
Statistic – Fact
Social media takes up a lot of our screen and online time, most of this is done using our smartphone. It is important to understand this when about to launch a social media advertising campaign.
25% of users admit to following their favourite brands on social media.
Statistic – Fact
37% of digital consumers use social media for purchase inspiration.
Statistic – Fact
Social media is being used to find inspiration and learn more about products and trends which give companies an opportunity to educate their target audience on their product.
9. 96% of B2C marketers believe that social media is one of the most relevant marketing platforms.
Statistic – Fact
Most marketers allocate a large portion of their budgets and time on social media campaigns, it has indeed become the largest window shopping in the world and it seems to continue to grow and nobody knows where it is leading to.
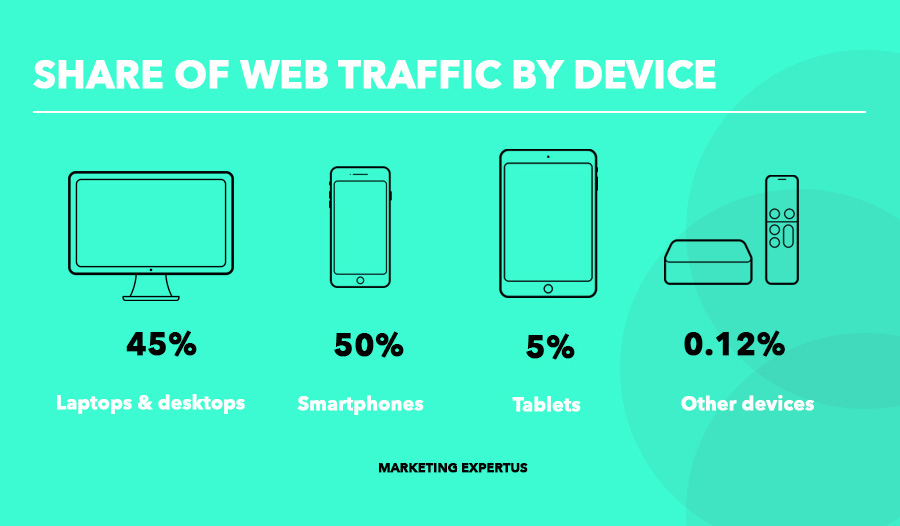
11. 69% of digital media time is spent on mobile devices.
Statistic – Fact
Smartphone and tablets account for 69% of the media time spent. Instagram and Facebook are the top media platforms when it comes to time spent by users.
14. 82% of smartphone users consult their phones while in a store.
Statistic – Fact
16. Email marketing campaigns have an average conversion rate of 4.29%.
Statistic – Fact
Email marketing campaigns are still at the top of the most cost-effective marketing campaigns with a conversion rate of more than four per cent. As opposed to other paid channels which conversion rate could be as low as a mere two per cent.
17. Gmail ads open rate is around 2% and its cost-per-click is of roughly $1. That drops to less than 20 cents for ads with an open rate above 25%.
Statistic – Fact
18. Revenue from email campaigns made up an average of 21% of companies’ overall revenue, up from 17% in 2016
Statistic – Fact
Google accounts for 94% of all organic traffic
Statistic – Fact
Google is leading the search maker for one more year. It looks like a total monopoly which has little to none competition with 94% of the entire organic search market.
The average Google first page result contains 1,890 words. (Backlinko, 2016)
Statistic – Fact
50% of search queries on Google contain at 4. (IMPACT, 2019)
Statistic – Fact
Search queries have become long and more specialled over the years. That is one of the reasons why Google has placed so much importance on local searches and businesses. Long strings of words of at least 4 items are the norm today while voice search continues to grow.
61% of executives admit that improving their organic traffic is their top priority. (HubSpot, 2018)
Statistic – Fact
Organic traffic and social media are the top challenges for marketers and brand today. Big companies are spending large sums of money on SEO and rankings are becoming more corporate-like with most brands dominated top converting keywords such as cheap flights and jeans…
70-80% of users disregard paid search results on Google. (MarTech, 2018) (Source: https://www.hubspot.com/marketing-statistics)
Statistic – Fact
Paid search results are disregards by most users who are looking for a more natural source. In general, the internet still considered a bit spammy therefore consumers are disregarding more ads than in any other format.
Billboard advertising statistics
Billboard advertising costs 80% less than television
Statistic – Fact
Billboard advertising can be much cheaper than running a commercial campaign on TV, on the other hand, television advertising possesses one of the highest engagement rate from all marketing channels.
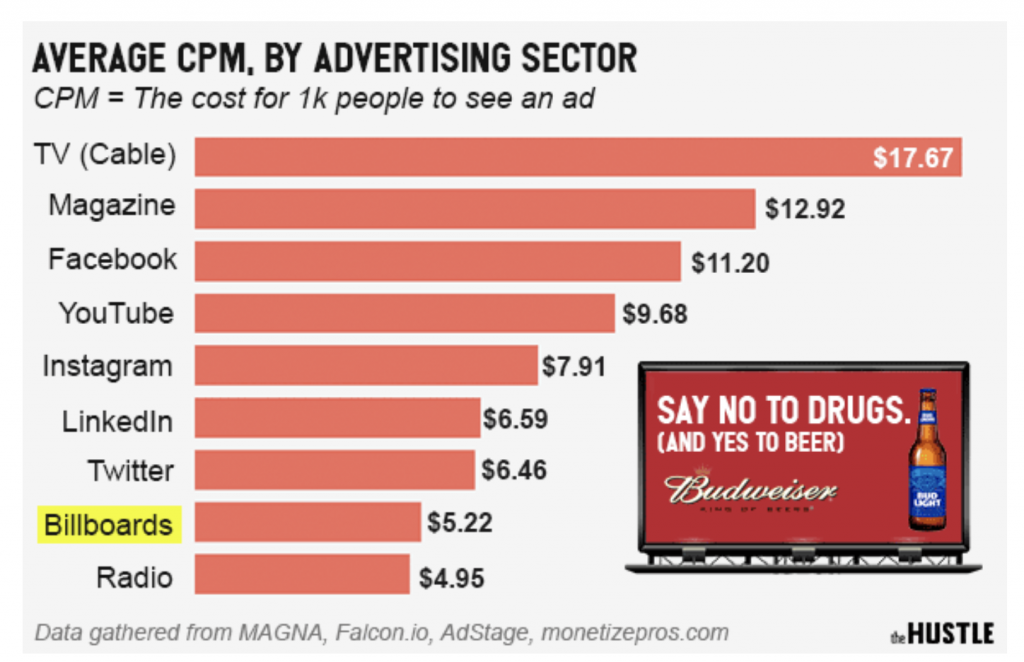
With an average CPM of $5.22, billboards are, in may cases, less cost-prohibitive than online ads whose prices continue to grow
Statistic – Fact

Billboards might seem like costly however they are surprisingly affordable. LinkedIn CPM is roughly about 35 dollars whereas billboards ads have an average of five dollars per thousand views. It needs to be considered the fact that billboards are seen as more trustworthy than digital ads.
71% of Consumers Often Look at the Messages on Roadside Billboards
Statistic – Fact
Billboards on the roadside are great at catching people’s attention. Actually, 71% of people admit to often look and remember billboards located on the sides of roads and motorways.
Nearly 26% of consumers visited a store as a result of seeing an OOH ad
Statistic – Fact
OOH advertising is still very powerful, especially at driving people into stores. About 26% of consumers visited a store after seeing an OOH ad. Combining an OOH ad campaign along with a digital one usually delivers the best results.
Billboards make up 66% of the OOH advertising market
Statistic – Fact
Over 7,800 digital billboards are currently active in the US
Statistic – Fact
A process of digitalization is undergoing the billboard industry. Like many other marketing channels, traditional advertising is becoming digitalized. And billboards are the ones that are changing faster. Digital billboards will mean more control over exposure time and buying, resulting in more affordable and effective advertising.
In the US, there are around 370k active billboards and about 15k new ones added each year
Statistic – Fact
The number of billboards is increasing each year as the population increases too. Just alone in the United Kingdom, the media company Clear Channel has over 4000 billboards and in the US, here over 370 thousand active billboards across the country.

The average cost per billboard in the UK is £200-500 for two week
Statistic – Fact
Billboard advertising only makes up about 7% of the total ad budget
Statistic – Fact
Clear Channel UK, the second-largest providers of OOH advertising has around 4000 billboards across the UK
Statistic – Fact
By 2021, billboards are expected to grow to a $33B industry
Statistic – Fact
Billboard industry – once being considered as outdated – is still growing and within the OOH advertising channel is consolidated among the strongest and most effective format. Experts predict that its revenue will continue to increase within the next two year up to 33 billion dollars.
Four of the 10 biggest billboard spenders are tech companies (Apple, Google, Amazon, and Netflix)
Statistic – Fact
Tech companies – considered the most innovation in the market – are the ones that are investing most on billboards.
Marketers are very aware that billboards are still very powerful and while most executives are speeding up their digital campaigns, others stay loyal to traditional but effective channels.
98% of people see an OOH ad each week
Statistic – Fact
OOH ads are everywhere and most of the people would see at least one ad a week. While surfing online, users are exposed to multiple windows and ads at the same, OOH advertising catches consumers while they are on the street and less influenced by multiple distractions.
Radio advertising statistics
Over 92 % of Americans over 12 years old listen to the radio weekly
Statistic – Fact
Since the rise of the internet, podcasts, and music streaming services, it seems like traditional media such as radio and print are not as relevant as they used to be. Radio consumptions have dropped in favour of digital platforms.
Radio audience comes up to over 235 million listeners
Statistic – Fact
Online radio consumption has increased over the last years and nowadays it accounts for 20% of the total
Statistic – Fact
There are more country music stations in America than any other type with over 2,000. News/talk follows with 1,375 stations
Statistic – Fact
It seems like those folks out there are still enjoying as much country music as they have done ever before. Although traditional radio is switching towards a podcast format, radios can still carry a lot impact on consumers, specially while driving.
Major brands such as Verizon, Home Depot, Walt Disney and Burger King are among the top 20 largest radio advertisers
Statistic – Fact
Since radio, podcast and streaming services merge together in the future to programmatic advertising, this will make radio buying more affordable, accessible and easier to track.
Retail, automotive, insurance, restaurants and financial institutions are the largest advertising industries for radio
Statistic – Fact
Radio advertising is more suited to certain industries and markets. It is usually more powerful at driving consumers to their local stores and build brand awareness to local businesses.
The largest spenders belong to retail, automotive and insurance, and they mainly use it to build brand awareness.
Radio advertising revenue surpassed $20 billion in 2017, and over $15 billion is from local businesses
Statistic – Fact
Most radio advertising customers are local businesses. Radio is most effective when used to promote local businesses and raise brand awareness locally. It can also be very effective when used as very specialised advertising, for example, advertising a drink during a sport competition.
All type of radio formats reach 90% of the population in the UK every week (Rajar)
Statistic – Fact
Radio might be seen as an old unused media however radio still manages to reach 90% of the population in the United Kingdom. If we do not listen to it at home, we might be exposed a radio channel at the gym, shop or when driving on the road.
Radio advertising can still be a very powerful way to reach consumers, especially when used in combination with other channels, its effectiveness can be enormous.
89.7% of the UK’s (54.4m adults over the age of 15) listen to the radio each week
Statistic – Fact
Average of 21.3 hours a week
Statistic – Fact
Surprisingly, our radio consumption is about 21 hours a week. We are mainly exposed to radio while out of home, for example, at shops, gyms, while driving and sometimes even at work.
This year its reach is up to 9.8m each week in the UK (The Drum)
Statistic – Fact
Radio grew at a relatively steady pace over the last few years and this progress can be also seen in the last year when radio managed to reach almost 10 million people a week.
Digital radio consumption grows every year, from 45.2% at the end of 2016 to 49.9% a year later
Statistic – Fact
Digital radio and podcasts are still growing while traditional radio might seem not to be performing so well. A podcast strategy for your company could be a great way of promoting your company.
OOH advertising statistics
OOH advertising is one the most traditional and oldest advertising formats. However this should not lead anyone to think that it is less effective, quite the contrary it is one of the most effective advertising channels.
Out-of-home advertising revenue in the UK is 1.6bn
Statistic – Fact
People spend 70% of their time outdoors
Statistic – Fact
The internet has had a huge impact in our lives however, it is not just all about the digital world. People still spend around 70% of their time outdoors which means every company should have an OOH advertising strategy.
Nearly 26% of people visited a store as a result of seeing an OOH ad
Statistic – Fact
OOH advertising is more effective at driving consumers into stores. Actually about 26% of people admit having visited a store after seeing an ad outdoors.
Most supermarkets and large outlets make the most of billboards and OOH banners.
98% of consumers are exposed to some format of OOH advertising each week
Statistic – Fact
83% of people admit remembering OOH ads they saw within the last 30 min of going shopping (Outsmart, Window of Influence, 2011)
Statistic – Fact
The digitalization process that is happening in our society is affecting almost every aspect of our lives including something so traditional and old such as billboards.
The all static printed billboards are being turned into digital screens which offer more flexibility to advertisers by allowing to show dynamic ads with video and to have more control over ad scheduling.
In the US, there are around 370k active billboards and about 15k new ones added each year
Statistic – Fact
The number of billboards is growing in the US, especially, digital billboards.
Statistic – Fact
3.79 ROI for retailers per every $1 spent on Out-Of-Home advertising
Statistic – Fact


Having read this I believed it was extremely enlightening.
I appreciate you taking the time and effort to put this informative article together.
I once again find myself spending a significant amount of time both reading and posting comments.
But so what, it was still worthwhile!